Connor Fitch and Taylor Meredith
Here is the final result
Our goal was to design a logo for the REU and build a code that could animate a random walk of scattered points that would converge to our logo design.
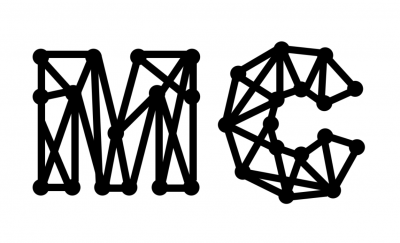
We start from a black and white image of our logo:

Each white pixel of the image is assigned a zero, while each black pixel is assigned a one. We want our animation to start from uniformly distributed black points, each following the path of a Markov chain that would bring all the points to the black pixel locations (i.e. our logo). Once the a point hits the logo, it says near it.
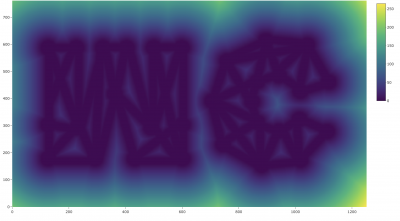
First we created a distance function $$d(x,y)$$ to find the distance between each point on the screen and the nearest black pixel. Below is the heat map that depicts the distance function distribution of our image. You may notice that the logo is flipped here because in converting the image to a matrix, the top left corner is read as the origin.

We then constructed a Markov chain based on the distance function. In this Markov chain, the probability of moving to a neighboring pixel location is biased towards the set of black pixels. The transition function is
$$ p(x,y) = \frac{\displaystyle e^{- \beta d(x,y)}}{\displaystyle e^{- \beta d(x’+1,y’)}+e^{- \beta d(x’,y’+1)}+e^{- \beta d(x’-1,y’)}+e^{- \beta d(x’,y’-1)}}$$
where $$(x,y)$$ is the point’s new location and $$(x’,y’)$$ is the point’s old location, and $$\beta>0$$ is a parameter representing the strengths of the bias.
The value of $$\beta$$ is small when the point is in a white pixel location, and we then switch to large $$\beta$$ once hitting a black pixel location. This change in $$\beta$$ greatly decreases the likelihood that a point would move from a black pixel location to a white pixel location, hence once a point reaches a black pixel region it should stay within the region. Within the black pixel region the distance is zero, thus $$p(x,y)$$ becomes a uniform distribution where the points can move with a constant probability.
The code was written in R and the animation was done with Plotly. Here is the raw animation:
For this logo animation, we took inspiration from Jan Krepl who built a similar animation for logos using a Markov Chain Monte Carlo method. You can check out the website here: https://jankrepl.github.io/creating-animations-with-MCMC/
Krepl designed his code to drop points over time, which is different from our code which starts with all the points scattered. Starting with this logo:

Finally, here is an implementation of Krepl’s code to our logo:
